
When you invest resources and money in your website, it is worthwhile to pause and ask yourself whether what you are doing is working. As you’re running your website, you must keep an eye out on how well your channels are converting, the number of your site visitors and who they are.
Your conversions to a grouse extent depend on how well the site is performing, thus, you won’t go far without proper website speed optimization. Yet with Google Analytics and other analytics tools providing a plethora of metrics, it is easy to get lost in the benchmarks and put out of account the most significant ones. It is a known fact that some metrics are less important than others, therefore, identifying key performance indicators (KPI) should be one of the main tasks for site owners.
To help you get started with website analytics, in this article, I’ve gathered and broken down the 6 major ones that are used for measuring website performance.
1. Website Traffic
What’s the first step that you need to make so that your potential clients take further action? Exactly, getting them to visit your website. That said, the total number of visits (also referred to as just web traffic) is among the major metrics that are important to any web-based resource. Luckily, this metric isn’t that difficult to track via Google Analytics.
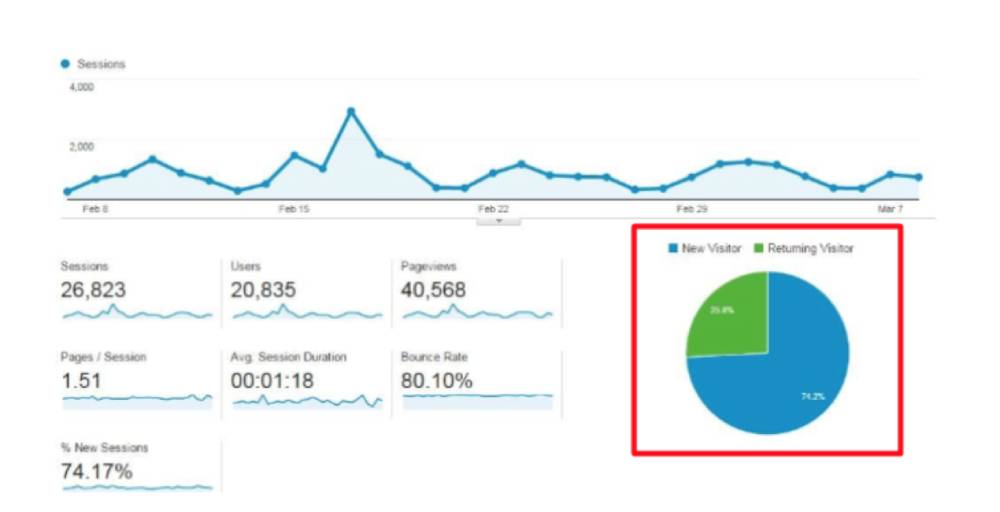
- Measuring website traffic
Why do we need to track this metric? Put simply, website traffic is a reliable indicator of how the site is performing. The main aim of this particular KPI is to assist in identifying how well your site is doing (whether it’s thriving, standing still, or facing a decline).
Another way this metric can be a helping hand is for measuring your promotion moves. Specifically, this is done by evaluating the traffic that’s generated by your strategies. For instance, if you’ve noticed a traffic spike after publishing a blog post on a specific topic, this is a signal that you’re on the right track and must continue moving in this direction to make your blog a more fruitful source that brings you traffic. The other side of the medal here is if the KPI signals that your traffic is declining, this is a sustainable hint that you’ve made a wrong turn and that you must continue experimenting with topics to find the needed niche.
Explanatorily, I’d like to note that the total visits are often split into two categories:
- unique visits (this metric tells you how well you are coping with attracting new visitors);
- repeat visits (shows you how good you are at retaining existing guests).
An important point that you must understand here is that even if having large web traffic is your case, this in no way ensures that things are going great. Yes, big site traffic numbers do suggest that you’re moving along the right lines but, in essence, just landing people on your website isn’t enough. You must be positive that the visitors are the exact target audience that you were looking for and that you’ve done everything right to make them convert once they’ve visited the site. This precisely explains why it’s crucial to understand the sources of your traffic.
2. Traffic Sources
The traffic source metric is the one that shows the origins of the users that land on your website, in particular, it explains where they’re coming from, how did they find you, via which channel. This metric will identify the “headwaters” and break down the “roads” that users take to get to you. Plus, it’s a great way to better understand your site performance and get a hint of what should be undertaken to obtain better-targeted quality visitors.
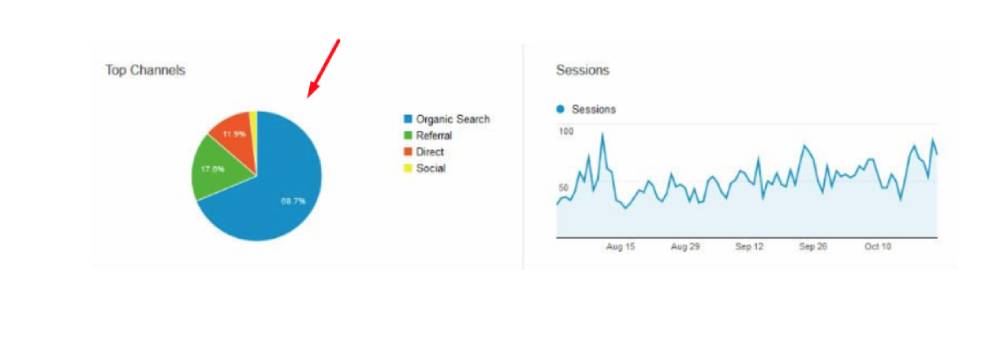
- Traffic sources in website analytics
Once more, this KPI can be measured with the use of Google Analytics.
At a basic level, this tool distinguishes 4 major traffic source categories:
- Organic Search
The traffic coming from search engines. This metric is the one that reflects the effectiveness of your SEO strategy. Importantly, it also demonstrates whether your site is ranking well on Google or not.
- Referral
This is traffic from third-party sites. Generally, the referral traffic size is most often influenced by how well your link building strategy is lined out. The least you can do here is reflect on your expertise and create amazing site content that’ll be worthy of sharing by others. But what do lots of links mean to Google? They somewhat serve as proof that the content that your website has is trustworthy and brings value to the users. If you’re often referred to by good resources, then your ranking grows.
- Direct
Direct traffic source is the case when many people put in your website name (domain) right in the browser. After all, if a large percentage of your audience knows your site and doesn’t have to find it using a search engine, you’re doing good in terms of brand awareness and brand loyalty.
- Social
Traffic coming from social media channels. This point is twice is relevant for the eCommerce sphere with the rise of social shopping and the ability to hook up your product catalog with the store’s social media account to sell via social platforms (this regards the Shop functionality on Instagram, Facebook, and Pinterest, to give a few examples). If your social traffic is low, you must start giving your social media presence proper attention and to be more active across all the channels. Then you need to try to engage people by writing and sharing interesting content, leaving comments, and responding to messages.
Which traffic source is the most valuable? There is no accurate answer. The best source will differ from one business model to another, the same applies to the website itself (its main aim). Nevertheless, it’s considered a best-practice solution to balance them out and aim at having your traffic come from various sources. This will allow your site to keep the lights on if one of the sources dries up.
3. Conversion Rate
Your conversion rate is, perhaps, among the most essential and strategically important metrics for your business. It’s responsible for indicating how successful your website is in terms of profitability. Furthermore, it’s a perfect metric for evaluating the performance and effectiveness of your marketing efforts and strategy.
You can have different cut-off points that’ll serve as the action that’s considered as a KPI conversion. For instance, such an action can be converting the visitors into leads based on filled out forms or how many visitors were converted into buyers based on a successful sale.
If you’re a business owner, you have to be very quivery about conversion rates. Since if they’re low, this is an emergency siren that’s screaming that whatever you’re doing to convince people to make it to the last sales funnel stage is not going right. Thus, if you’ve noticed that your website conversion rate is low, start looking for the troublemaker, I’d suggest going through your UX and navigation first, then overview your content, and follow every step of the customer journey. There must be something you can improve somewhere.
The conversion rate is pretty easy to calculate: all you need to do is to divide the number of visitors by the number of conversions.
For instance, let’s pretend that you have an e-commerce store that sells cosmetics. Your main aim in regards to conversions will be having your site visitor make their way down the sales funnel and paying for their order. If your site had 100,000 unique visitors in April and 2000 people paid for the orders, your conversion rate is 2%.
For those of you who’d prefer to leave the math to the tools, consider this simple conversion rate calculator.
By all means, it is impossible to find a website with a 100% conversion rate on the web. But which figures are considered to be good for an online business? Well, to give a fair estimate, you should understand that conversion will be determined in much by the size of the business, what you sell, and who your audience is. However, marketing wisdom says that a good conversion rate for an e-commerce website is somewhere between 2% and 5%.
4. Cost of Customer Acquisition
Customer Acquisition Cost (CAC) lines out the price you pay for getting a client who can pay, it is calculated keeping in mind a specific time period. As the internet companies and smarter trackable ad campaigns are on the roll, this metric has been growing in use. The way you’re promoting your website makes no difference, you can be using an affiliate program, taking the content marketing path, investing in paid ads, in any case, the same principle applies.
Calculating CAC isn’t hard. Divide the cost of your marketing efforts (including salaries, commissions, bonuses, expenses) by the number of acquired customers.
The CAC formula:
CAC = (total cost of marketing or sales efforts) / (the number of customers acquired)
To make it clear, if, say, you‘ve spent $75,000 to acquire 1000 customers, your CAC would be $75, as far as CAC = ($75,000 spent) / (1000 customers) = $75 per customer.
Media campaign effectiveness, by all means, can be measured with this metric. The higher the number is, the more exy it is for you to earn a new customer. Reducing CAC will help you to recoup revenue and make your sales, marketing, or customer service processes more healthy.
For this reason, it’s advised to measure this metric for every channel separately. This way, you can get a landscape view of which one converts best. Finally, you can make conclusions on whether it is worth investing money in a particular channel or not.
5. Bounce Rate
The bounce rate is a metric that can tell you how many people land on your site page, spend some time researching the content and leave it without opening another page. Google treats this action as a “single-page session”, often simply called “bounce”.
To explain this in an easy way, if your bounce rate is high, this is an indicator of a significant rupture between the content that you present and what your visitors expect to see. This website KPI is bloody easy to calculate. The standard formula looks like this:
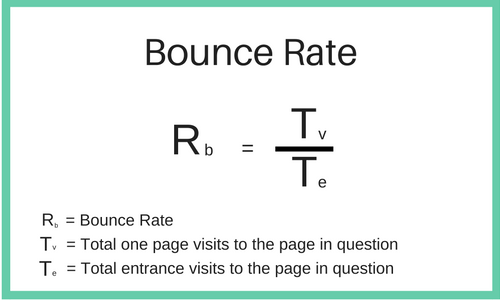
- Bounce rate calculation (source)
However, a low bounce rate is not always a direct sign that your site performance is endangered. This metric is going to be different based on the website type. Thus, the average e-commerce store should expect this metric to be somewhere between 20-40%, while the bounce rate at 50-70% is eligible for a landing page as all essential information naturally is placed on one page. This ultimately means that site navigation is well done, and that your site users won’t have to waste time searching for something they need.
Nevertheless, a higher number may indicate serious issues with a website. The ridgy-didge thing is that a high bounce rate, along with low dwell time, can be a reason for Google to degrade your page in search engines as this means that whatever content you have, it’s not what the users were querying, looking for, nor expecting when they’ve reached your page.
Some of the often-occurring reasons that cause a high bounce rate include:
- slow load time,
- unfriendly design and navigation,
- the absence of inbound links,
- bootless content,
- UX problems,
- poor website aesthetics,
- badly targeted keywords.
With this in mind, in order to allocate where the crevice is, there’s no other way to go than all-embracing research. In some cases, it is challenging to tackle it alone, especially if you are working with a complex CMS such as Magento. So, in such a case, I would recommend consulting professional developers to resolve all the issues to get more leads.
6. Page Load Time
My list of the most important website analytics can not be completed without a mention of the significance of speed. It’s quite well-known that the way users behave as they browse the internet or a specific website is changing. As such, people are becoming less patient and more irritated if the website page opening times are long, they are much more demanding in terms of the site’s user-friendliness, navigation, visual appeal, and ease of search, just to name a few.
According to the latest research, 53% of users abandon a site if its content takes over 3 seconds to load. Besides, Google also gives preference to those sites that perform faster, therefore, by decreasing the page load time will result in an organic traffic boost.
Again, you can track this KPI within your Google Analytics account.
Final Word
If you haven’t ever previously faced the need to track website analytics, don’t get intimidated by the plethora of statistics, numbers, charts, and percentages. With the top tracking software, the data will be presented in a user-friendly way so that everyone can master it.
Consider this: tracking website analytics provides you with a deadset picture, rather than just taking wild guesses. Hopefully, this list of the 6 most important website analytics worth tracking can give you a starting point.
About the Author
Alex Husar, CTO at Onilab with 8+ years of experience in Magento migration and Salesforce development. Graduated from the Czech Technical University and obtained a bachelor’s in Computer Software Engineering.